Announcing Salt Grafana
5 minute read Updated:
TLDR: This is an open-source set of components that uses Grafana stack to implement a visualization, observability and alerting tool for Salt. To start using it, please visit the documentation.
Open-source Salt observability tool based on Grafana
Purpose
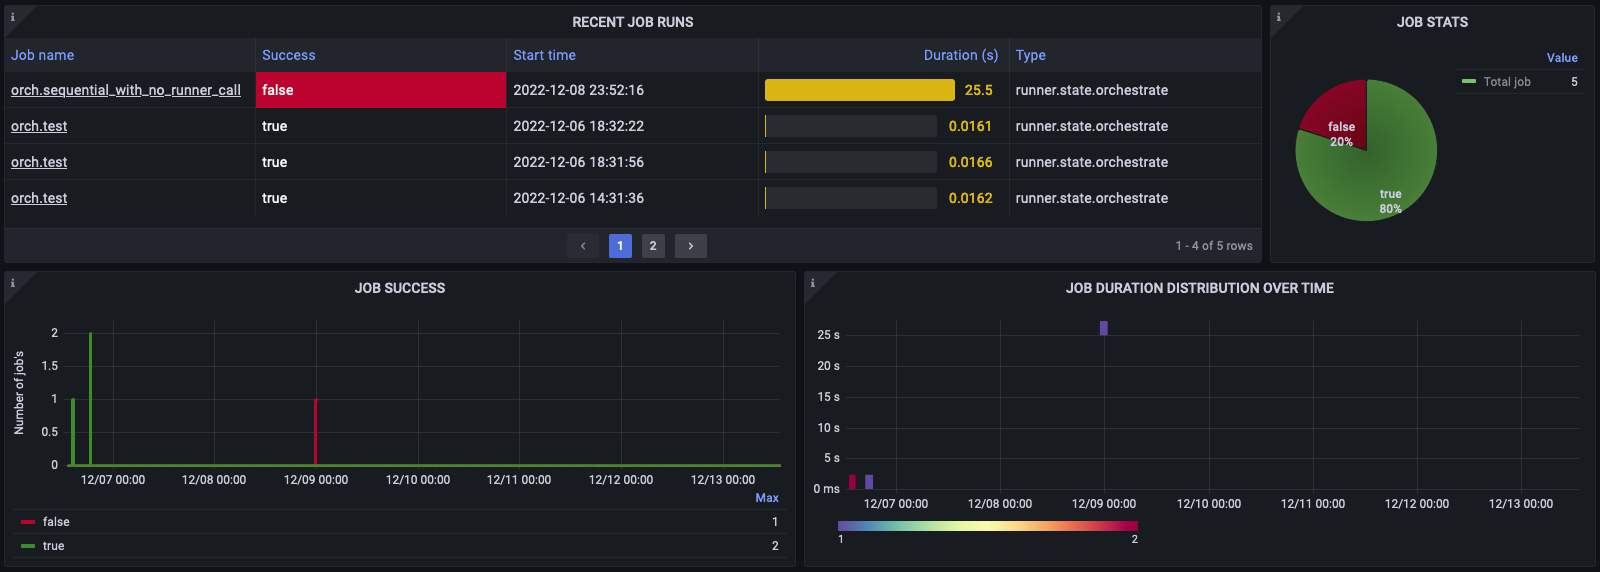
If you run a non-trivial number of jobs on a Salt master (especially in an automated way), some of the following questions should look familiar:
- How many jobs were run in a given interval?
- How many of them have changed something?
- How many of them have failed?
- Is the failure rate higher than normal?
- Why a particular job has failed (what is the error message exactly)?
- Instead of a full return data, can I just see an important stuff about the job (just show me the things that changed or failed)?
- Which jobs take the most time?
- What state(s) in a particular job take the most time?
- Can we find who ran a particular job?
- Which job changed a particular file or stopped a service (or failed to do so)?
- All of the above, sliced and diced by some label (master name, minion name, user, state file, saltenv, etc.)
- How to make an ad hoc query against the job history?
- I need to make a custom dashboard for the environment my team is responsible for.
- Oh, and I need to share this particular dashboard or a failed job result with my team.
- And my team needs to be alerted when something unusual happens.
If that rings true, then Salt Grafana is for you!
Design decisions
- Once configured, Salt Master settings don’t need to be changed to add a new metric, transformation or event destination. All transforms are done outside of Salt.
- Salt orchestrations are the primary units of work (but this constraint might be relaxed later).
- The default event parsers and Grafana dashboards were designed to deliver the visualizations required by one particular company, but the project is quite flexible and extensible. You are encouraged to tweak the default dashboards and panels, add new Vector transformations, metrics and alerts.
- The components are optional and are considered to be the building blocks you can mix and match. You do not have to use PostgreSQL job cache if you can live without the TreeView panel and do not need to ask complex questions that require ad hoc SQL queries. If you do not need to visualize orchestrations as traces, you can drop the Tempo Relay service and Grafana Agent.
- Some questions are easier to answer with SQL queries, some with LogQL.
- Grafana Cloud is used to reduce the amount of infrastructure to maintain. There is nothing that prevents using on-premise Grafana stack (although this wasn’t tested).
- PostgreSQL is used because Loki can’t store large blobs of data (the limit is 64 kb). Salt job returns (esp. for orchestrations) can easily exceed that.
- Although it wasn’t tested, the system should support multiple Salt masters (with the exception of a singular Job Cache DB that should be dedicated for each master unless it is a shared cache for HA setup).
- Vector engine should be usable not only on masters, but also on minions as well (although this wasn’t tested).
Architecture
Here is how the full system is wired together:
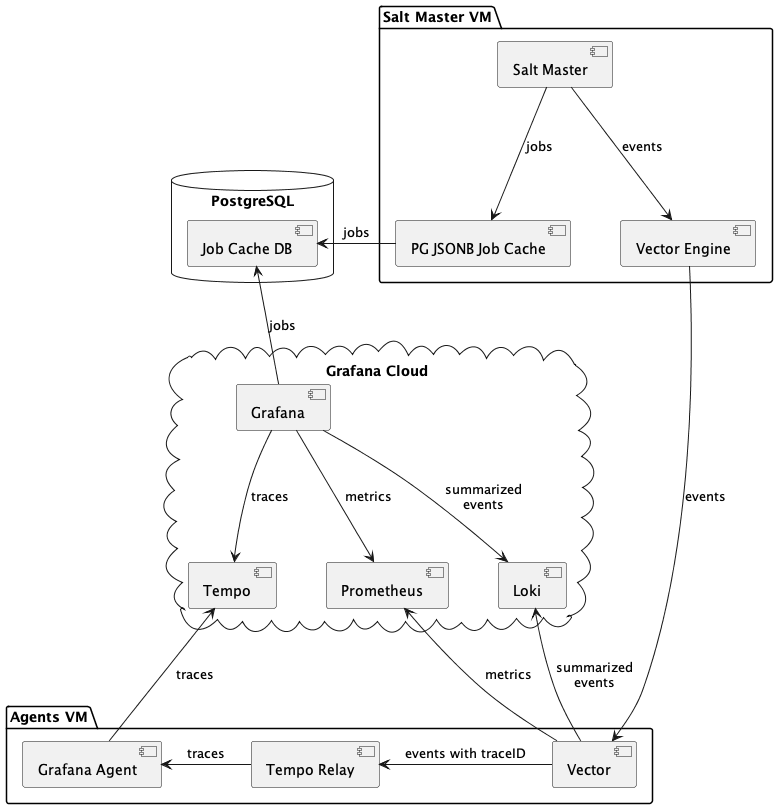
- Salt Master controls one or more minions and runs various orchestration jobs
- JSONB Job Cache (master returner) sends job returns to a PostgreSQL database. The DB schema has two custom views to make ad hoc queries
- Vector Engine sends Salt events to Vector (as JSON over TCP)
- Vector transforms incoming events
- Injects the traceID field, adds some tags
- Forwards events to the Tempo Relay service via HTTP
- Sends summarized job returns (without the nested
datafield) to Loki - Generates two Prometheus metrics (job duration and job status)
- Tempo Relay service transforms orchestration job returns into traces (using opentelemetry-sdk) and submits them to Grafana Agent
- Grafana Agent sends traces to Grafana Tempo
- Grafana dashboards use all four data sources (Loki, Prometheus, Tempo, PostgreSQL) to display various dashboards and navigate between them
Future ideas
- Future iterations might add support for module calls and highstates. For now, execution module calls and
state.applyorhighstatearen’t supported by the event transformations and default Grafana dashboards shipped with the project. - The proposed orchestration job metadata propagation feature #62683 opens up many interesting possibilities.
- It might be possible to replace the Tempo Relay service and Grafana Agent with just Vector, once it gets better support of traces (see #1444, #12029 and #14747).
- Graph the number of connected and disconnected Salt minions.
- Use Grafana metrics generator from traces to generate metrics at a finer level to allow setting alerts on any states or called runners; compute the DORA metrics of orchestration pipelines.
If Salt Grafana doesn’t do what you want out of the box, feel free to submit a merge request to the salt-grafana repo. If you want to contribute a complex or breaking change, please file an issue first to discuss it. Also, you can hire me to customize the tool for your specific needs.
Similar projects
I’m aware of three other projects that add metrics to Salt:
- Salt Exporter (also see the blog post)
- Salt Extension Modules for Prometheus
- Saltstack Exporter for Prometheus
If Salt Grafana is not the right tool for you, maybe other visual UIs for Salt that solve different use-cases might be useful. In the past, I’ve already compiled a list of Salt GUIs, but it is worth repeating it here for better discoverability:
- Alcali
- SaltGUI
- Silica
- Molten
- Foreman Salt
- Salt Dash
- SaltPad - unmaintained
- Obdi - unmaintained
- Saltshaker
- Salt Minion Manager
- Uyuni - the upstream project for SUSE Manager
It would be unfair not to mention a commercial offering from VMware called SaltStack Config (SSC, previously called SaltStack Enterprise or SSE), but it is quite enterprisey/expensive and seems to become more and more integrated into the VMware ecosystem.
Links and credits
This project was made possible by:
- Erick Alphonse and Nils Martin (idaaas.com)
- Max Arnold (yours truly)
- Kristoffer Granberg Cauchi (turtletraction.com)
The project links are:
Join the mailing list
And get other useful Salt tips and tricks. Unsubscribe at any time.
Powered by Mailgit
You can follow me on Twitter to find more useful tips like this: